Charts
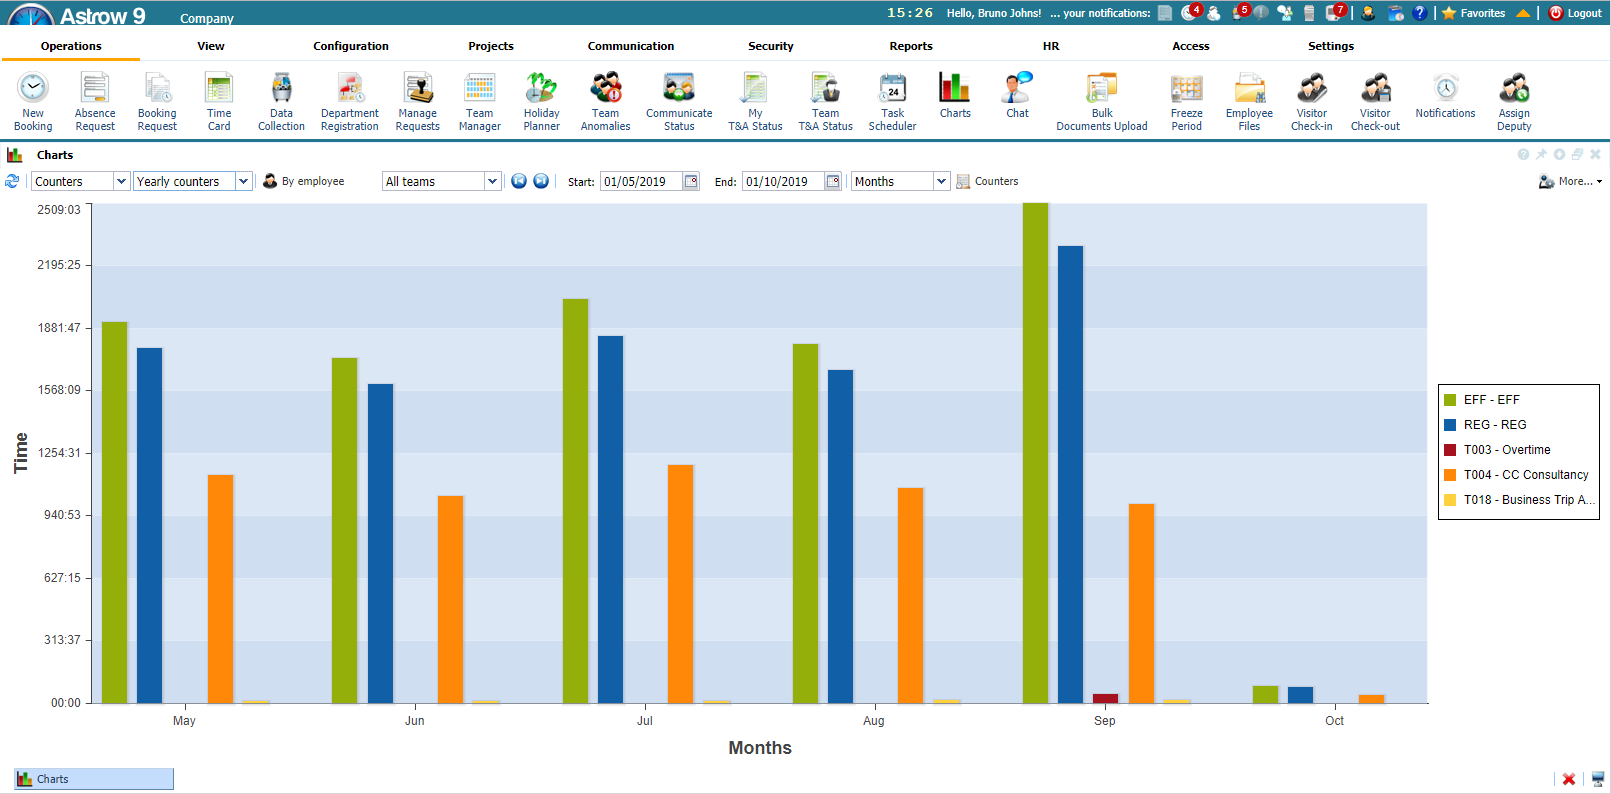
Menu Charts in Operations provides a graphical view of employees data in Astrow and enables the users to export the data in a chart format for an efficient and quick view of employees' T&A evolution. Charts functionality requires a license to get the full power of graphical data. Charts can also be displayed in Dashboard.
Charts license
Charts are available with license. However, basic charts are available without license. These are the restrictions of the limited charts:
-
Only charts based on Counters are possible without license. The Absences option is still visible in combo but cannot be selected.
-
Maximum 3 counters can be selected.
-
Only one chart configuration per user (both dashboard and from menu).
-
Only possible for MSS users.
-
Only possible for maximum 5 users (MSS).
-
Displays data from the last 35 days.
 |
|
Charts in Astrow Web
|
Creating a chart configuration
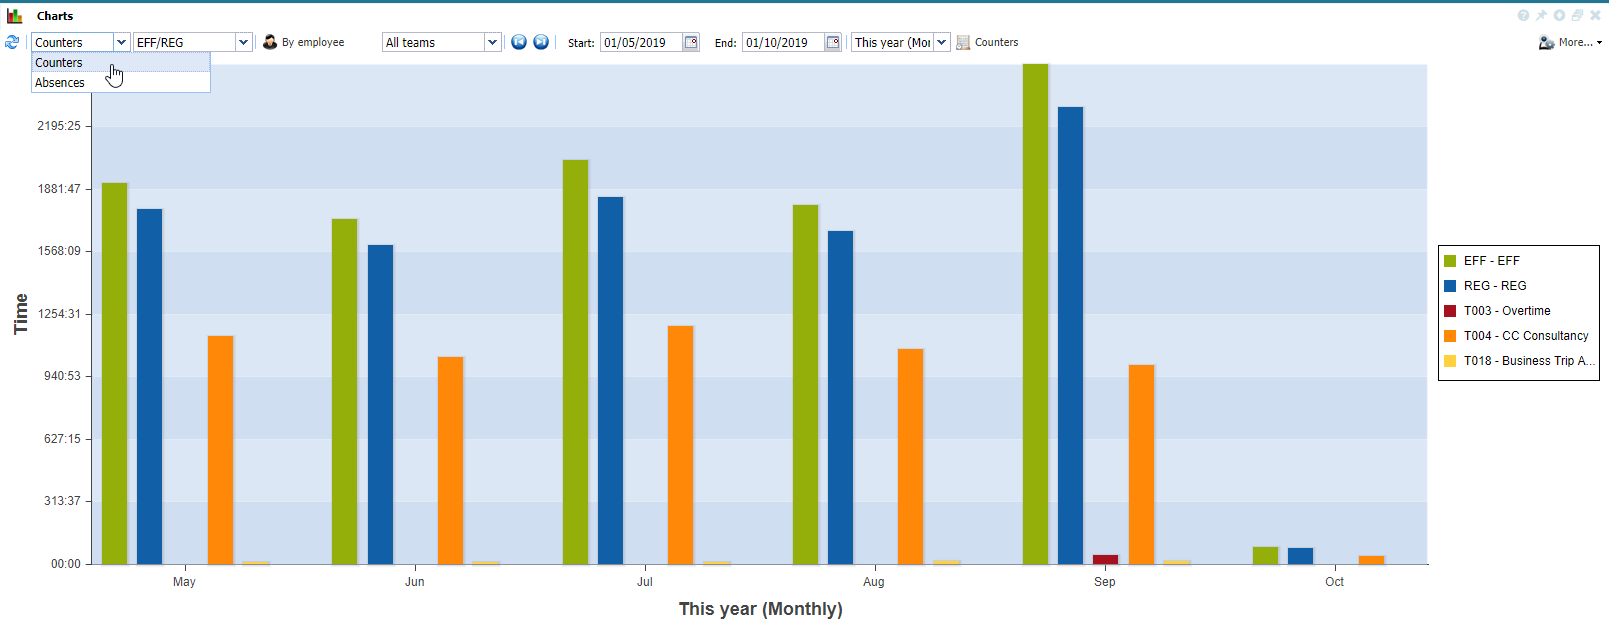
Step 1: Select the configuration type Counters or Absences.
 |
|
Selecting the configuration type in Charts in Astrow Web
|
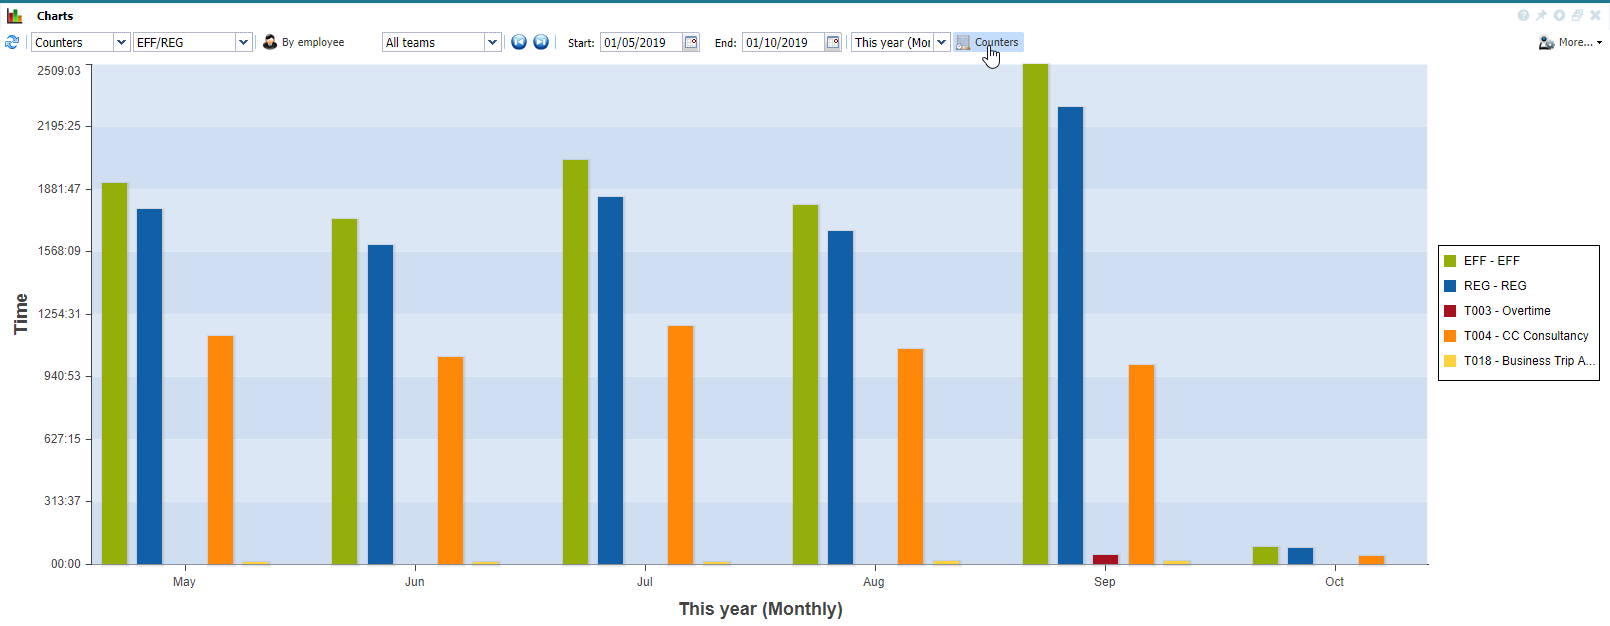
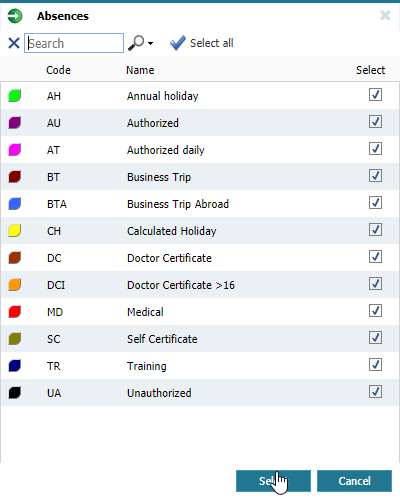
Step 2: Select the counters or the absences to include in the view.
 |
|
Selecting the data to display in Charts in Astrow Web
|
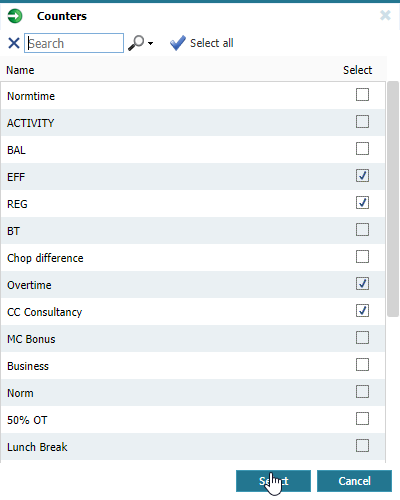
The selection buttons,  or
or  , will help you filter the data desired.
  |
|
Data lists for Charts in Astrow Web
|
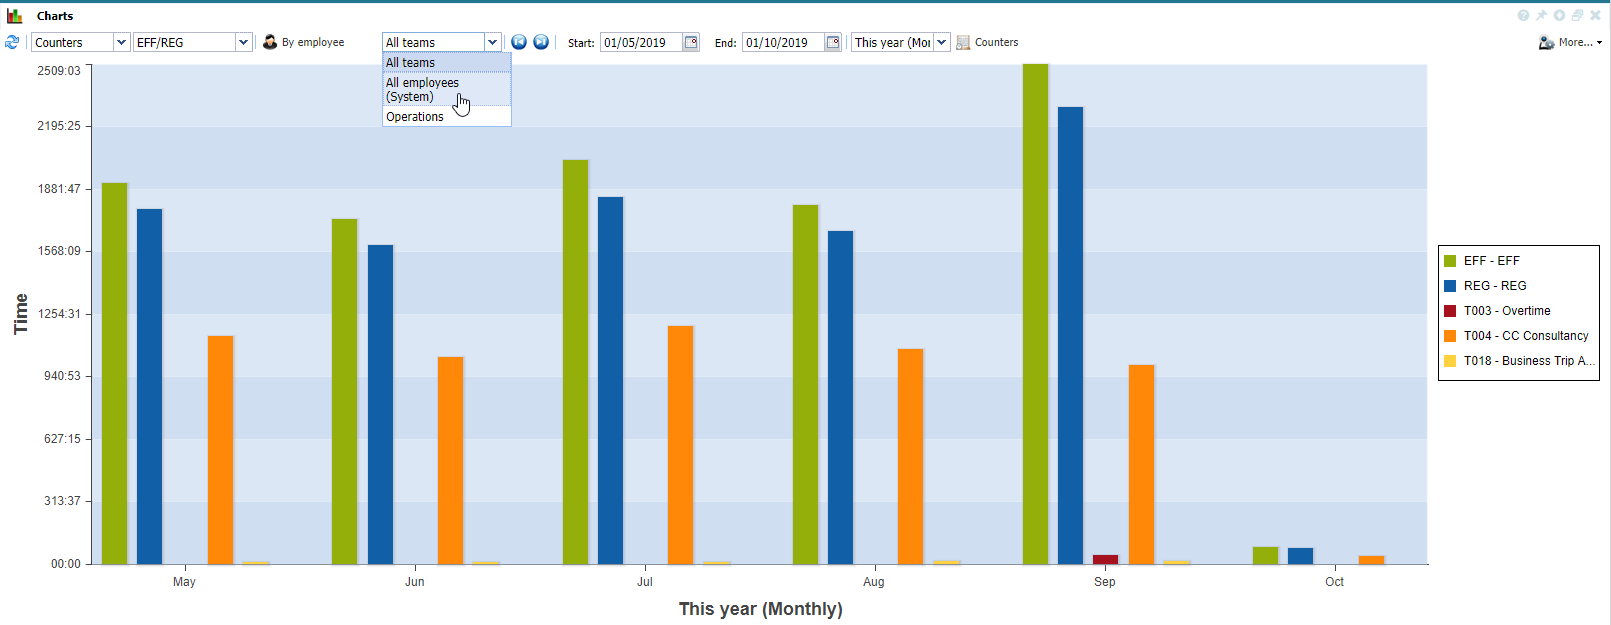
Step 3: Select the employees or group of employees.
 |
|
Selecting the team for Charts configuration in Astrow Web
|
The buttons  and
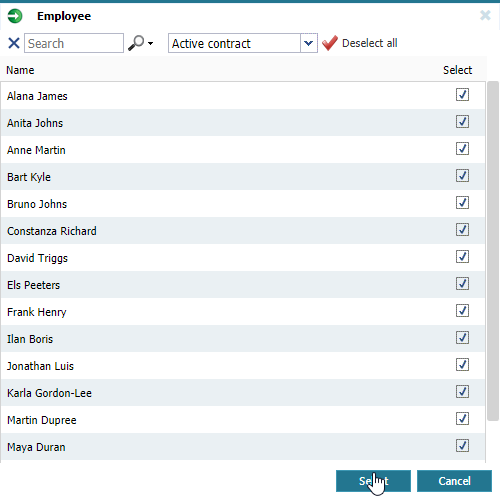
and  will switch the current selection. Use the button
  to select the employees:
 |
|
Selecting the employees for Charts configuration in Astrow Web
|
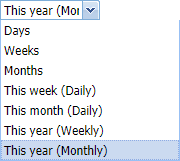
Step 4: Select the time period over which the analysis will be made.
|
|
Sort by periods of time.
|
 |
|
|
Go to previous or next period.
|
|
|
|
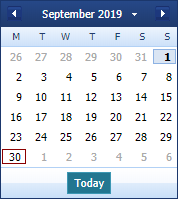
Calendars for starting date and ending dates.
Choose the starting date (and ending date for customized periods) for a calendar displayed.
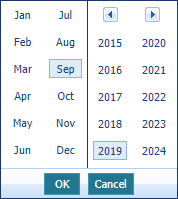
You can search through previous month
The button
|
  |
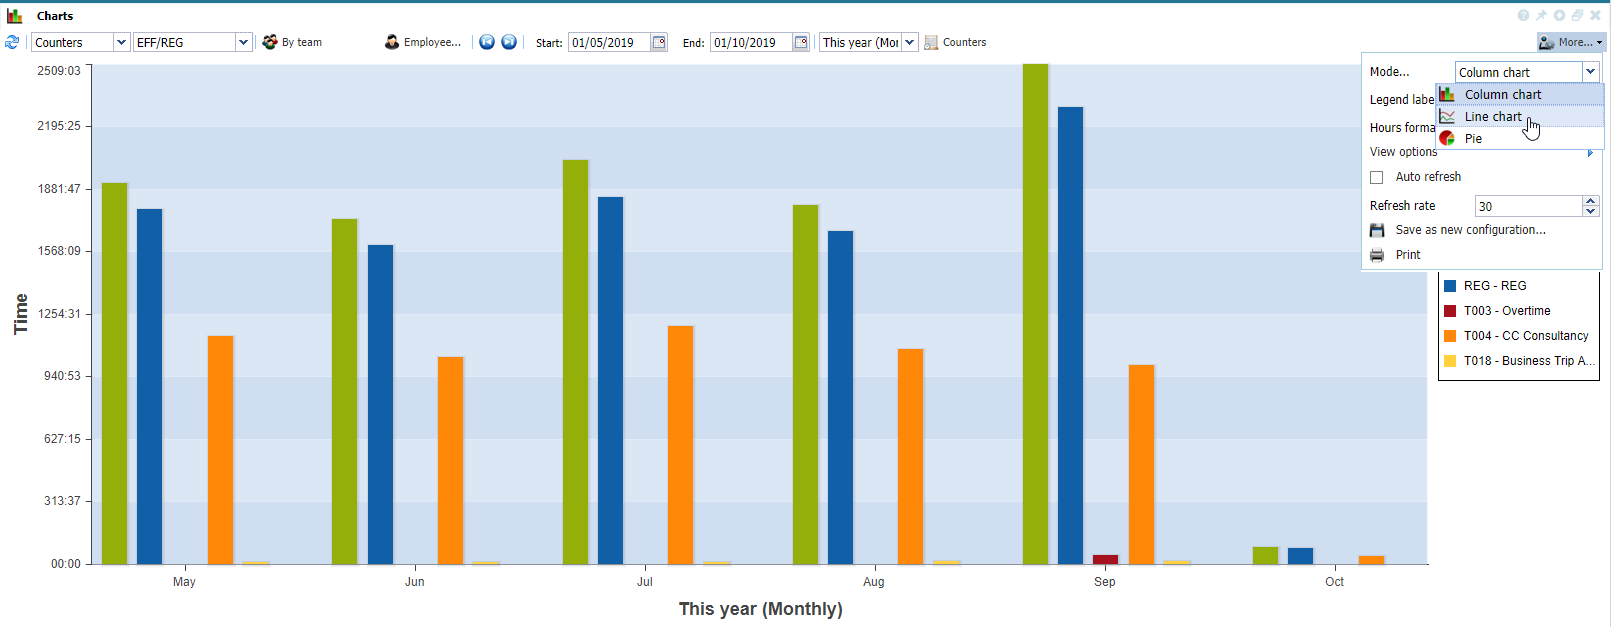
Step 5: Define the chart preferences.
 |
|
Defining the preferences for Charts configuration in Astrow Web
|
Configuration options:
|
|
Choose the type of statistical view.
|
 |
|
|
You can include the variable name, code or both code and name.
|
 |
|
|
You can choose to refresh automatically, especially if you display it on a monitor.
|
|
|
|
Here you define the refresh rate.
|
|
|
|
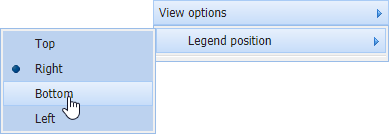
Here you define the position of the legend (for view or print).
|
 |
Step 6: Save the configuration with  button.
 |
|
Saving a chart configuration in Astrow Web
|
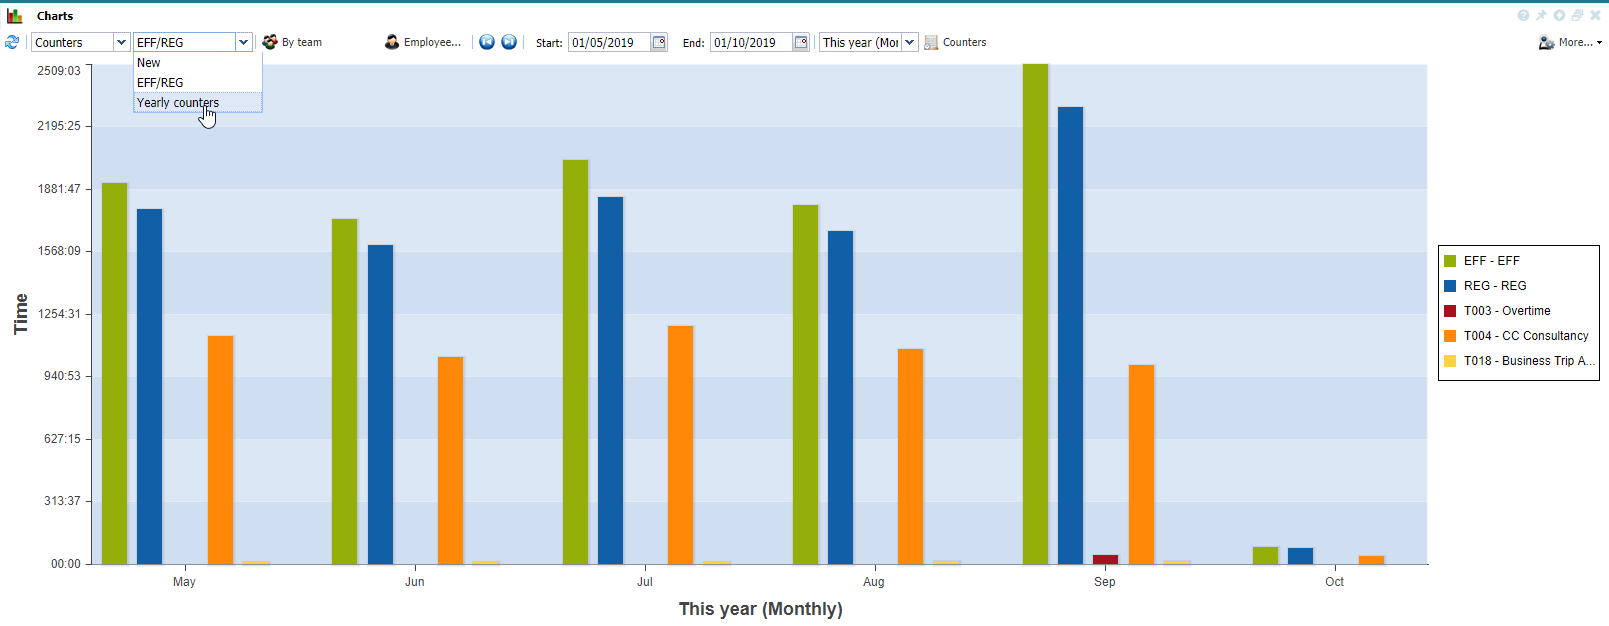
The configurations saved can be chosen from the list. The default configuration is EFF/REG.
 |
|
Changing a chart configuration view in Astrow Web
|
You can also print the current configuration with button  .
.